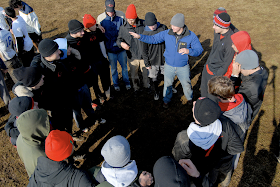
We played a total of 7 games for a total of points.149 points. We were broken 17 times on offense (24.65% of O Points) and generated 31 breaks on defense (38.75% of D Points). Our offensive efficiency was 75.36%, which is our percentage of scoring when we are on Offense. We recorded a total of 80 goals for the weekend. One of those goals was Bailey's first Callahan. There were 94 turnovers. We got 53 defensive blocks for the weekend. The team touched the disc for a total of 913 times. I am pretty sure we were way over 1,000 because the touch stats from the GT and the Cornell game seem a little off (hard to record so many touch stats when you give and go so much).
Here are the teams leaders
Points Played :
Goals Caught :
Goals Thrown :
D's :
1. Matthew Bailey - 13 defensive blocks, 23.63% of team total
Touches :
Retention Rate (minimum of 20 touches):
Points Played :
1. Taylor Nilan - 101 points, 67.78% of total
2. Peter Dempsey - 99 points, 66.44% of total
3. Matthew Bailey - 88 points, 59.06% of total
Goals Caught :
1. Matthew Bailey- 16 goals, 20% of team total
2. Peter Dempsey - 14 goals, 17.5% of team total
3. Brian Walter - 7 goals, 8.75% of team total
T4. Caleb Edwards - 6 goals, 7.5% of team total
T4. David Hooten - 6 goals, 7.5% of team total
T4. Tom Ball - 6 goals, 7.5% of team total
Goals Thrown :
1. Peter Dempsey - 26 assists, 32.91% of team total
2. Taylor Nilan - 12 assists, 15.19% of team total
T3. Robert Herrig - 8 assists, 10.12% of team total
T3. Caleb Edwards - 8 assists, 10.12% of team total
D's :
1. Matthew Bailey - 13 defensive blocks, 23.63% of team total
2. Taylor Nilan - 7 defensive blocks, 12.72% of team total
3. Peter Dempsey - 6 defensive blocks, 10.90% of team total
Touches :
1. Peter Dempsey - 175 touches, 18.79% of team total
2. Robert Herrig - 171 touches, 18.36% of team total
3. Taylor Nilan - 147 touches, 15.78% of team total
Retention Rate (minimum of 20 touches):
- Calculates the % of throws that weren't turnovers
1. Robert Herrig - 95.91%
2. Matthew Bailey - 94.12%
3. Taylor Nilan - 91.84%
DID NOT PLAY :
Michael Slade
Michael Harper
Charlie Herrig
Max Leonard
Steven Hedges
